
Power Electronics & Test Technical Knowledge Base
Explore technical articles, industry insights, and power testing innovations from Chroma engineering experts.
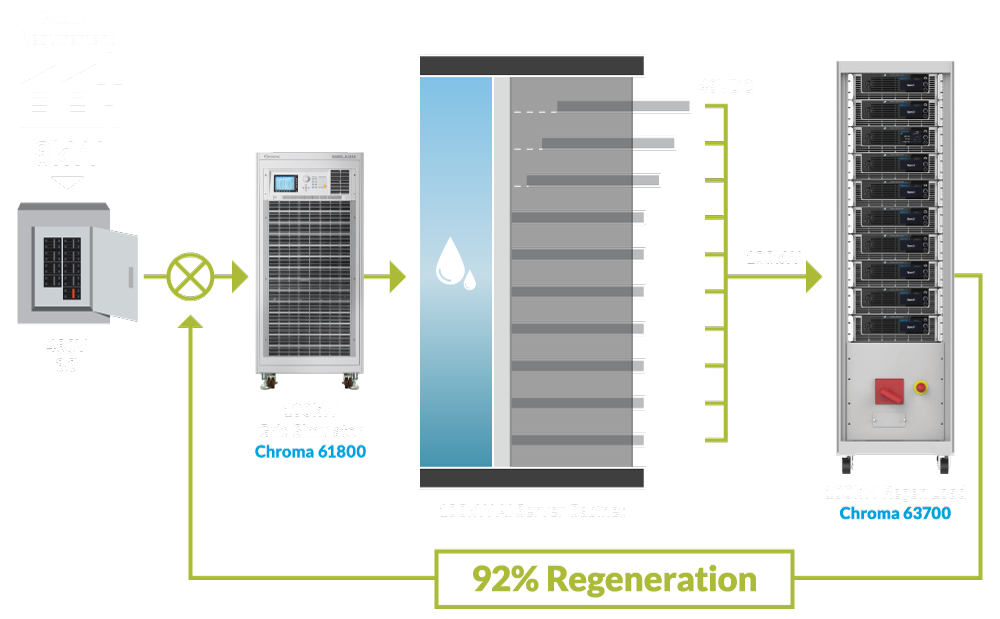
How to Choose an AI Server Power Grid Simulator?
An AI data center can behave like a small, fast-changing power system. GPU servers draw substantial electricity, and their demand may shift sharply during training or inference. A simulator helps teams examine those changes before they affect equipment, operating costs, or service availability. But a polished dashboard is not proof of a useful model.
The AI Server Power Grid Simulator you choose should represent the conditions your facility actually faces. Check whether it can model server-level loads, rack power limits, cooling demand, backup systems, and grid disturbances. Ask how its inputs are measured and how often its models are validated. Andrew Ng, an AI expert, has said, “AI is the new electricity.” His comparison is a reminder that AI infrastructure depends on dependable energy, not just capable software.
Look closely at practical tests. Can the tool reproduce a sudden workload spike? Can it show voltage changes, peak demand, and backup response on a clear timeline? Can engineers export results and compare predictions with meter readings? These details matter more than a long feature list.
No simulator is perfect. That matters. Models simplify real equipment, and poor assumptions can make confident-looking results misleading. A careful evaluation should include data quality, integration effort, cybersecurity controls, vendor support, and total ownership cost. The right choice is not necessarily the most complex one. It is the system your team can validate, explain, and use to make safer, better-informed power decisions.
What an AI Server Power Grid Simulator Models
How to Choose an AI Server Power Grid Simulator?
What an AI Server Power Grid Simulator Models
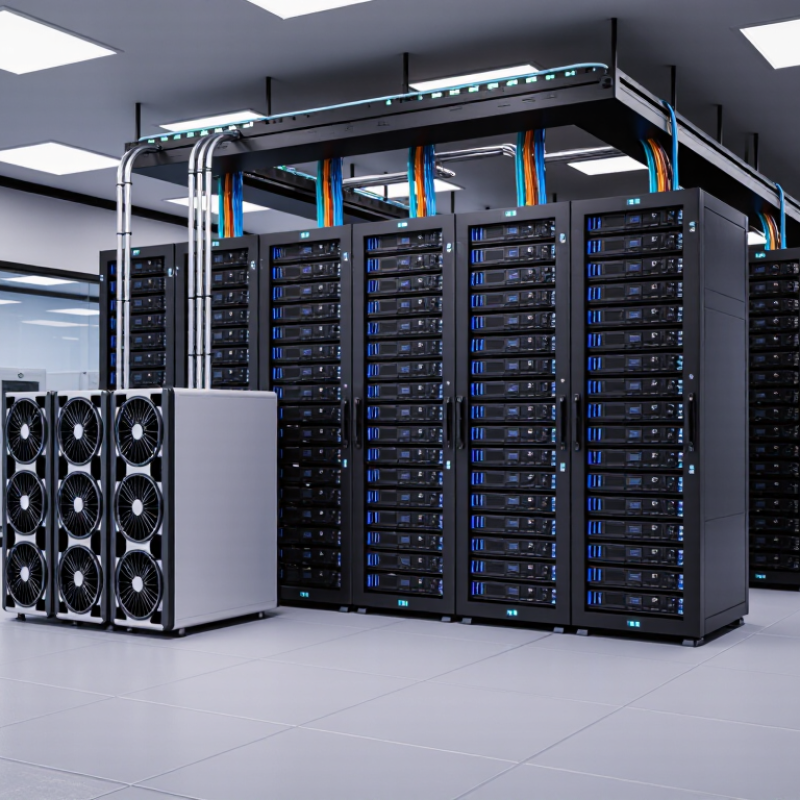
An AI server power grid simulator represents how electricity moves from the utility connection to individual racks. It can model transformers, switchgear, backup systems, power distribution units, and server loads. Each component has limits. A transformer may overheat under sustained demand, while a narrow feeder can cause voltage drops at distant racks.
The simulator also tracks changing workloads. Training jobs can raise power demand sharply, then leave servers drawing less during idle periods. Models may include cooling equipment, conversion losses, battery behavior, and transfer delays during a supply interruption. Useful outputs include rack-level power, voltage stability, heat, and estimated runtime. For example, engineers can test whether a 40-kilowatt rack remains within limits when neighboring racks ramp up together.
Scenarios matter. A credible model can examine peak demand, equipment outages, delayed battery response, and uneven load distribution. It should make its assumptions visible, including load forecasts and component efficiency. That is where models can feel too neat. Real facilities have imperfect sensor data, maintenance variation, and unexpected workload bursts. Compare simulation results with measured facility data, then update the model when the two disagree. A precise-looking chart is not proof that every electrical path behaves as predicted.
How to Choose an AI Server Power Grid Simulator?
What an AI Server Power Grid Simulator Models
This illustrative 10 MW-class facility scenario breaks demand into IT servers, cooling, power-conversion losses, and other facility loads. A simulator can use these load profiles to assess grid demand, ramp behavior, equipment loading, and response to demand curtailment. Values are modeled examples, not measurements from a specific site.
How to Define Your Server Power and Grid Requirements
Before choosing a simulator, define the load it must represent. List server counts, accelerator types, rated power, and expected utilization. Then separate steady demand from short bursts; a rack drawing 40 kW on average may still spike higher during intensive workloads. Include power factor, UPS losses, cooling demand, and redundancy. Name the load precisely.
Grid assumptions matter too. Specify supply voltage, transformer capacity, feeder limits, allowable ramp rates, and backup duration. Model peak demand alongside equipment failures and maintenance windows. The International Energy Agency’s Electricity 2024 report estimates that electricity use by data centres, AI, and cryptocurrency could reach 620–1,050 TWh by 2026, up from about 460 TWh in 2022. In the United States, Lawrence Berkeley National Laboratory’s 2024 data center report estimates data centers used 4.4% of national electricity in 2023, potentially rising to 6.7–12% by 2028. These figures underline why local grid constraints need careful checking. A spreadsheet estimate can still be wrong; validate it against measured rack and facility data.
Tips: Record peak and average loads separately. Test a failed feeder and a sudden workload surge. Revisit assumptions after commissioning. Small gaps matter.
Which Simulation Capabilities to Compare
Compare simulators by the problems they can reproduce, not by the number of features on a screen. Can the model represent minute-by-minute AI server loads, sudden GPU ramp-ups, transformer limits, voltage dips, and backup transfers? IEA’s Electricity 2024 report estimates data centres, AI, and cryptocurrency used about 460 TWh globally in 2022, with demand potentially exceeding 1,000 TWh by 2026. That scale makes realistic load shapes essential.
Check whether the tool models the whole path from utility connection to rack-level loads. It should test feeder capacity, UPS and generator transitions, redundancy failures, and power-quality events under normal and stressed conditions. The U.S. Department of Energy’s 2024 report, prepared by Lawrence Berkeley National Laboratory, estimates U.S. data centres used 176 TWh in 2023 and could use 325–580 TWh by 2028. A useful simulator should let teams examine several demand scenarios, then trace which constraint binds first. Test it twice.
Ask how simulation results are validated. Compare outputs with utility data, equipment specifications, and measured site behavior where available. Inspect time resolution, assumptions, and uncertainty ranges; a smooth chart can hide a brief but damaging voltage sag. No model is perfect. That is worth admitting. A practical selection exercise should include a realistic failure case, such as a feeder outage during a rapid server-load increase, and verify that operators can understand the resulting alerts and recovery sequence.
How to Evaluate Accuracy, Scalability, and Integration
How to Choose an AI Server Power Grid Simulator?
How to Evaluate Accuracy, Scalability, and Integration
Accuracy matters when a simulated load ramp could trigger a real capacity decision. Compare the simulator’s voltage, frequency, and power-flow results with measured site data. Test sharp changes, such as a GPU cluster rising from idle to full load within minutes. Ask how the tool handles uncertainty and missing telemetry. A precise-looking chart is not proof of a reliable model.
Tips: Test one realistic scenario before scaling up. Change the load in 15-minute steps, then compare predicted transformer loading with recorded readings. Check whether results stay consistent when you refine the time interval. Small mismatches deserve attention.
Scalability means more than running a larger network model. Check how performance changes when you add server halls, backup systems, and detailed operating schedules. Integration is just as practical: confirm that the simulator can use your existing meter data, export results in usable formats, and connect through documented interfaces. A trial with imperfect data can expose hidden cleanup work. I would still question any result that lacks clear assumptions; the model may be useful, but it cannot remove uncertainty from the grid itself.
How to Choose an AI Server Power Grid Simulator: Accuracy, Scalability, and Integration
| Evaluation Dimension | What to Examine | Practical Evaluation Method | Suggested Acceptance Check |
|---|---|---|---|
| Power-flow accuracy | Bus voltage magnitudes and angles, line flows, transformer loading, and convergence behavior. | Run the same network cases in the simulator and a trusted reference power-flow tool. Include normal loading and stressed operating points. | Compare results against defined tolerances for the intended study. Record maximum and average deviations, not just a single overall score. |
| Transient and dynamic fidelity | Response to voltage dips, load steps, generator trips, and other disturbances relevant to the use case. | Replay documented disturbance scenarios and compare time-series outputs, event timing, and recovery behavior with reference data or validated models. | Confirm that the simulator reproduces the required phenomena and time scales. Validate event timing and response error against project-specific limits. |
| AI model validation | Prediction error, uncertainty estimates, performance on unseen operating conditions, and sensitivity to input quality. | Use separate training, validation, and test datasets. Test rare but plausible conditions and check for data leakage across time or scenarios. | Set error limits before testing. Require uncertainty or out-of-distribution indicators when predictions are used beyond the training envelope. |
| Power-system model coverage | Support for the network elements and controls in scope, such as buses, lines, transformers, loads, generators, and protection or control models. | Map required model types and parameters to the simulator’s supported representations. Verify units, sign conventions, and parameter conversion. | All critical assets and control behaviors in the study scope should be represented or explicitly documented as limitations. |
| Scalability and runtime | Runtime, memory use, and throughput as network size, scenario count, or time-series length increases. | Benchmark representative small, medium, and large cases on the intended hardware. Track runtime per case and resource use under concurrent workloads. | Confirm that measured throughput meets the project’s scenario volume and turnaround requirements, with capacity for expected growth. |
| Co-simulation and time synchronization | Coordination with data-center, building, storage, renewable, or control-system models; time-step handling; and exchanged-variable consistency. | Run a coupled test with representative models. Check timestamp alignment, units, boundary conditions, and behavior when one component runs slower. | Demonstrate stable, repeatable exchanges at the required time resolution and document how missed steps or communication delays are handled. |
| Integration and interoperability | File-format support, APIs, scripting, data import and export, and compatibility with existing engineering workflows. | Import a representative network model and time-series dataset, automate a batch run, then export results for independent review. | Confirm that the required data can be transferred without manual re-entry and that interfaces, schemas, and versioning are documented. |
| Reproducibility and auditability | Scenario configuration, model versions, input data, solver settings, and traceable output records. | Repeat a run from a saved configuration and compare outputs. Review whether changes to inputs or model versions are recorded. | Require repeatable results for the same configuration and a clear record of inputs, assumptions, software versions, and run settings. |
| Operational security and deployment | Deployment options, access controls, data handling, network boundaries, and update or backup procedures. | Review the deployment architecture with IT and security teams. Test permissions, data flows, backup restoration, and offline or restricted-network operation if needed. | Confirm that deployment and data-handling practices meet organizational requirements before connecting operational or sensitive datasets. |
| Total evaluation fit | Alignment among accuracy, runtime, integration effort, maintainability, and the intended engineering decision. | Score candidates against a weighted test plan using the same models, scenarios, hardware, and acceptance rules. | Select the simulator that passes critical requirements and provides measurable evidence; treat suggested thresholds as project-specific, not universal standards. |
Evaluation note: Acceptance limits depend on the study objective, model fidelity, reference data quality, and operational constraints. Define test cases and tolerances before comparing tools, and distinguish measured results from vendor or model claims.
How to Match a Simulator to Your Deployment Needs
Choose a simulator around the decision you need to make: sizing a new connection, checking backup capacity, or coordinating AI racks with cooling equipment. The International Energy Agency estimated data centers used about 460 TWh of electricity globally in 2022, with demand potentially approaching 1,000 TWh by 2026. That growth makes average-load testing insufficient. Model the actual deployment: rack counts, GPU utilization patterns, cooling loads, and expected expansion.
For a site near its utility limit, prioritize feeder constraints, transformer loading, voltage stability, and peak demand. For a modular deployment, test how each added rack changes the load profile. The U.S. Department of Energy’s Lawrence Berkeley National Laboratory estimated U.S. data centers used 176 TWh in 2023, and projected 325–580 TWh by 2028. That wide range matters. Ask whether the simulator can compare multiple growth and efficiency scenarios, rather than presenting one forecast as certain.
Include abrupt workload changes and equipment faults. A training job starting across several racks can create a different power profile from steady inference. Test cooling-system starts, generator transitions, and component outages, then compare results with measured site data. No model is perfect. Forecasts can miss operational details, so document assumptions and update them after commissioning. A useful simulator should match your data quality, engineering staff, and planning horizon—not just offer the most features.
FAQS
Record server counts, accelerator types, rated power, and expected utilization. Separate steady demand from short bursts. Be specific.
A rack averaging 40 kW may draw more during intensive workloads. That gap can affect capacity planning.
Include supply voltage, transformer capacity, feeder limits, ramp rates, and backup duration. Check local constraints carefully.
Yes. Account for cooling demand, power factor, UPS losses, and redundancy. Missing details can distort estimates.
Compare voltage, frequency, and power-flow results with measured site data. Test a realistic load change. Then compare readings.
Model a GPU cluster rising from idle to full load within minutes. Check predicted transformer loading against recorded readings.
Add server halls, backup systems, and operating schedules to test performance. Confirm the tool can use meter data and export usable results.
Ask how the simulator handles missing data and uncertainty. Try imperfect data during a trial. The chart may look precise, but assumptions still matter.
Conclusion
Choosing an AI Server Power Grid Simulator begins with understanding what the tool represents: the relationship between server workloads, power demand, electrical infrastructure, and grid behavior. Before comparing options, define the deployment’s requirements, including server capacity, expected load patterns, power limits, redundancy needs, and the conditions the simulation must examine. Clear requirements make it easier to distinguish essential capabilities from features that are not relevant to the project.
Compare simulators based on their ability to model realistic workloads, test different operating scenarios, and present useful results. Evaluate accuracy, scalability, and compatibility with existing data and engineering workflows, since these factors affect whether simulations remain dependable as a deployment grows or changes. The right choice should fit the project’s size, complexity, and planning goals, while helping teams identify power constraints, assess grid impacts, and make informed decisions before implementation.

Blog Tags: